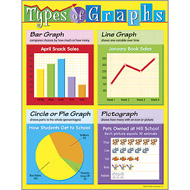
Types of Graphs
There are Bar Graphs, Line Graphs, Broken Line Graphs, Picture Graphs, and Pie Graphs. A Bar Graph is used for comparing your data, Line/Broken Line Graph is used for changes overtime, A Pie Graphs are used for quantity it represents, A Picture Graph is used for representing a certain number of people, cars, factories, etc.
What You Need To Make A Graph
You would need a appropriate scale, zigzag, origin, title, x and y axis, appropriate graph type, legend or key, your data, labels (for x and y axis), and a range. The range is the numbers between the highest and lowest numbers in your data. To find the range in your set of data you will need to subtract the lowest number from the higher number to find your range.
When To Use A Graph
Graphs are used when you need to organize information which would be known as your set of data. When you have your data together you would start putting it on your graph, but before you would need to choose an appropriate graph type, when you chose your graph then you will start putting your data on your graph.
 RSS Feed